EE
- 451 / E01 spring 2003
Advanced
Communications Theory
Professor:
Conner
Submitted
By:
Andrew
Buettner
Lab
#1: Introduction to MATLAB, Signals and Spectra
Sunday, March 02, 2003
Table
Of Contents
1)
Cover Page 1
2)
Table of Contents 2
3)
Objective 3
4)
Components Used 3
5)
Procedures 3
6)
Lab Data / Results 4
1) Diagram
1 4
2) Diagram
2 4
3) Diagram
3 5
4) Diagram
4 5
5) Diagram
5 6
6) Diagram
6 6
7) Diagram
7 7
8) Diagram
8 7
9) Diagram
9 8
10) Diagram
10 8
11) Diagram
11 9
12) Diagram
12 9
13) Diagram
13 10
14) Diagram
14 10
7
Answers to Lab Questions 11
7)
Conclusions 11
8)
Attachments 11
Objective
The objective of this lab is to gain a fundamental understanding
of the MatLab[TM] application. This will
be accomplished by applying various simulation techniques.
Simulation is necessary as the circuits themselves are too
complicated to be realized reasonably.
Components Used
1) PC with MatLab[TM],
octave, or SciLab installed.
Procedures
1) Using MatLab, or another
program simulate a 4Hz cosine wave by using the following commands:
a)
n=0:255;
b)
t=n/256;
c)
f=4;
d)
omega=2*pi*f;
e)
x=cos(omega*t);
f)
plot(t,x);
2) Create a second signal in
the same manner with f=32Hz, and plot both using "plot(t,x,t,y)"
3) Create
a new function, z(t) = x(t)*y(t) by using "z = x.*y;"
4) Plot
all three functions
5) Using
the fft function, plot the spectra using X(1:256) to display the
spectra of x(t), y(t), and z(t).
6) Justify
that the spectra are correct.
7) Re-compute
Z = fft(z)
8) Set
the 37th and 221st sample of the Z array to
zero.
9) Explain
what effect this has on the signal.
10) Using
the command "z=real(ifft(Z));" plot the filtered time
domain function.
11) Justify
the waveform.
12) Find
the dot product between x(t) and y(t) using "xy = x*y'"
13) Justify
the value produced, and determine if the functions are orthogonal.
14) Find
two functions that are orthogonal to x(t) and have the same
frequency as x(t).
15) Verify,
using the program, that the functions are, in fact, orthogonal to
x(t).
Lab
Data / Results
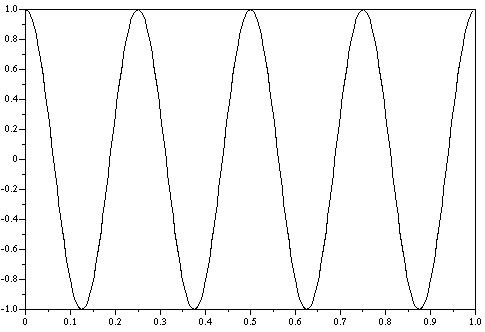
1) Diagram 1: SciLab output
for 4Hz sinewave
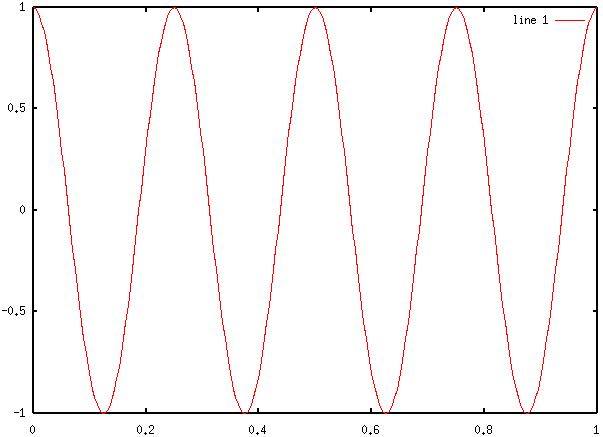
2) Diagram 2: Octave output
for 4Hz sinewave
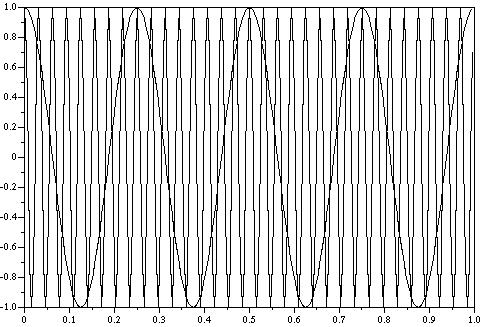
3) Diagram 3: SciLab output
for combination of 32Hz and 4Hz sinewaves.
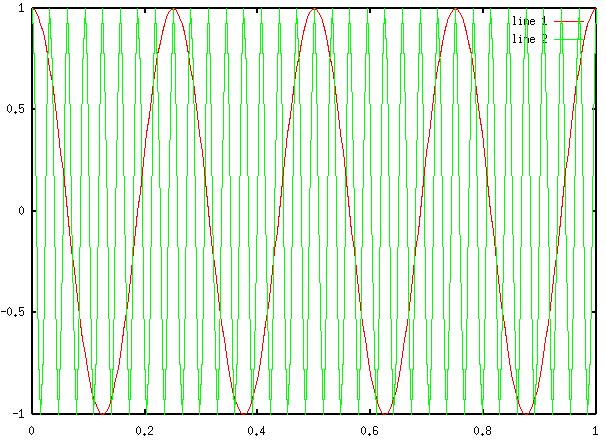
4) Diagram 4: Octave output
for combination of 32Hz and 4Hz sinewaves.
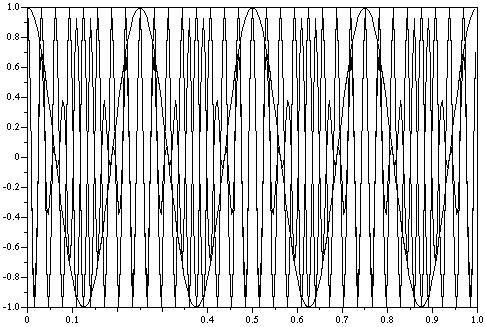
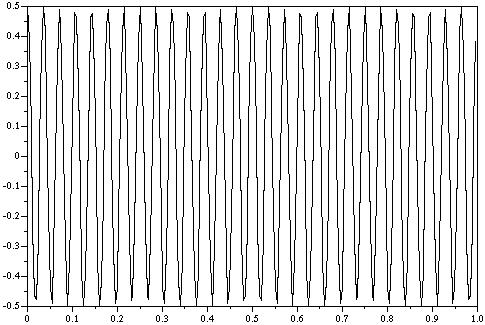
5) Diagram
5: SciLab output for 32Hz sinewave, 4Hz sinewave, and the resulting
waveform of the two multiplied together.
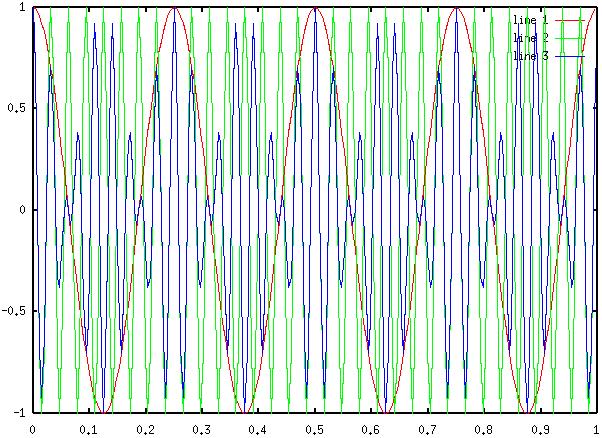
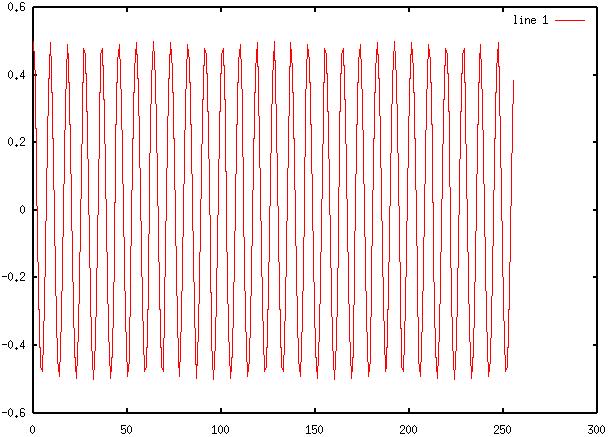
6) Diagram 6: Octave output
for 32Hz sinewave, 4Hz sinewave, and the resulting waveform of the
two multiplied together.
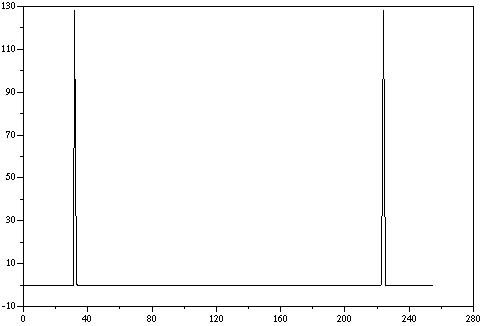
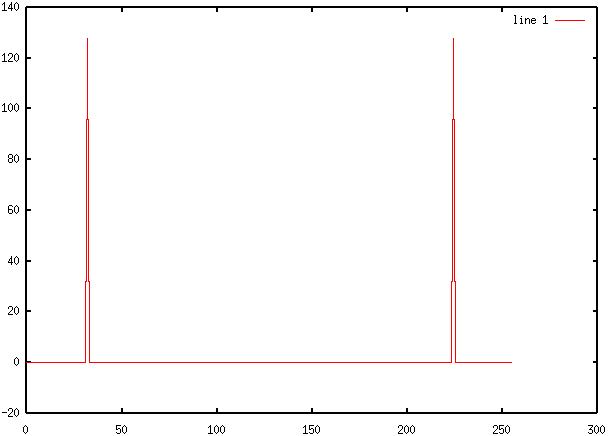
7) Diagram 7: SciLab output
of fft(y(t))
8) Diagram 8: Octave output
of fft(y(t))
9) Diagram 9: SciLab output
of fft(y(t))
10) Diagram 10: Octave
output of fft(y(t))
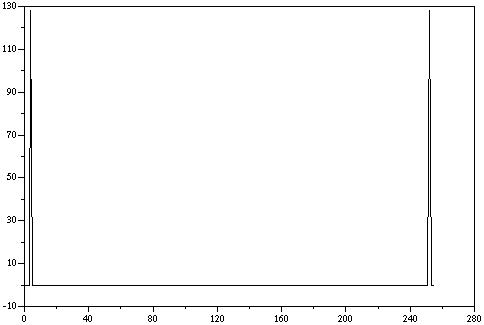
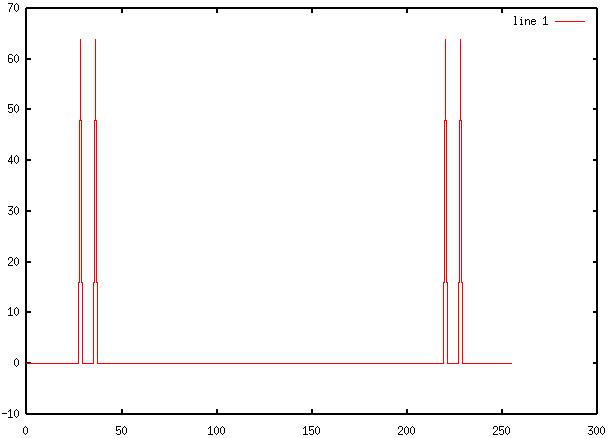
11) Diagram 11: SciLab
output of fft(z(t))
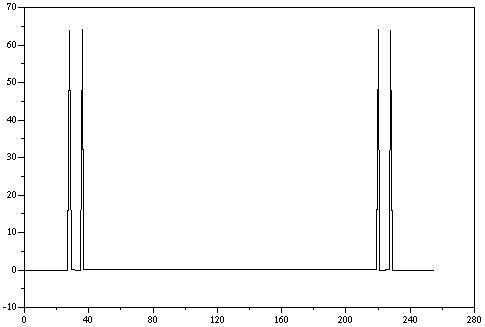
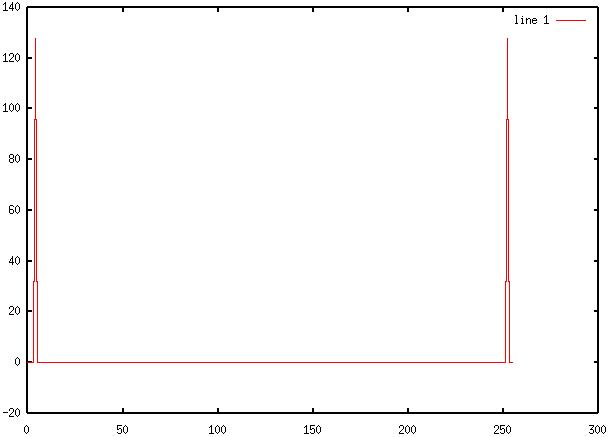
12) Diagram 12: Octave
output of fft(z(t))
13) Diagram 13: SciLab
filtered time-domain signal
14) Diagram
14: Octave filtered time-domain signal
Answers to Lab Questions
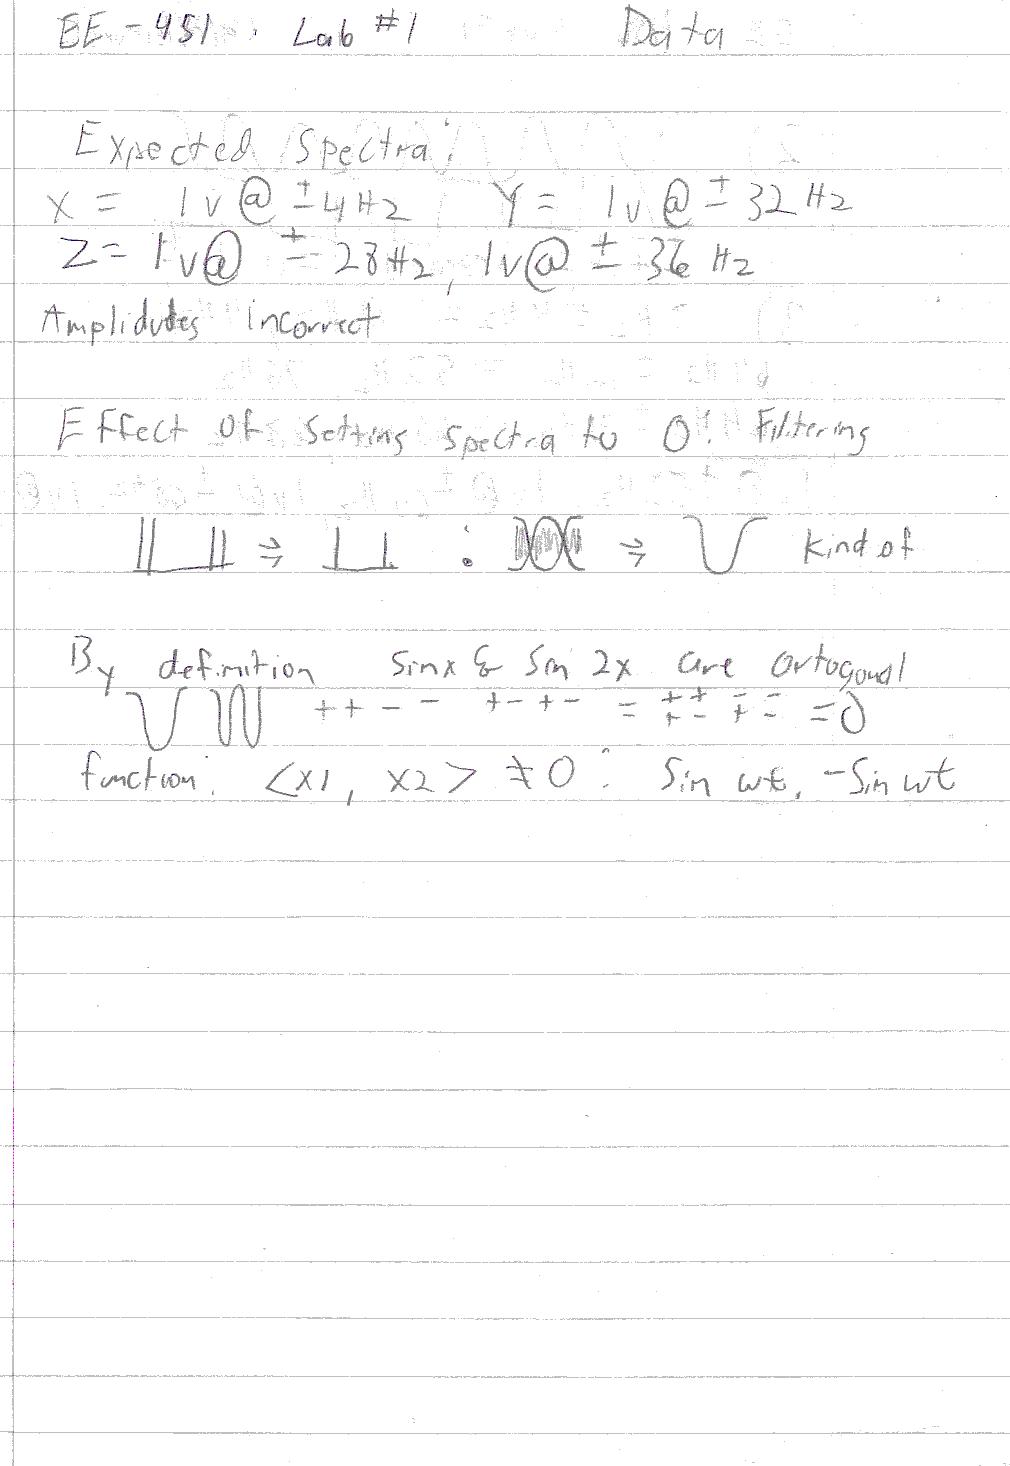
1) Q: Find the exponential
Fourier series of x(t), y(t), and z(t), how do they compare to X,
Y, and Z?
A: x(t) = 1v @ +/- 4Hz -
The spectra is correct except for the amplitude; y(t) = 1v @ +/-
32Hz - The spectra is correct except for the amplitude; z(t) = 1v
@ +/- 28Hz, 1v @ +/- 36Hz - The spectra is correct except for the
amplitude.
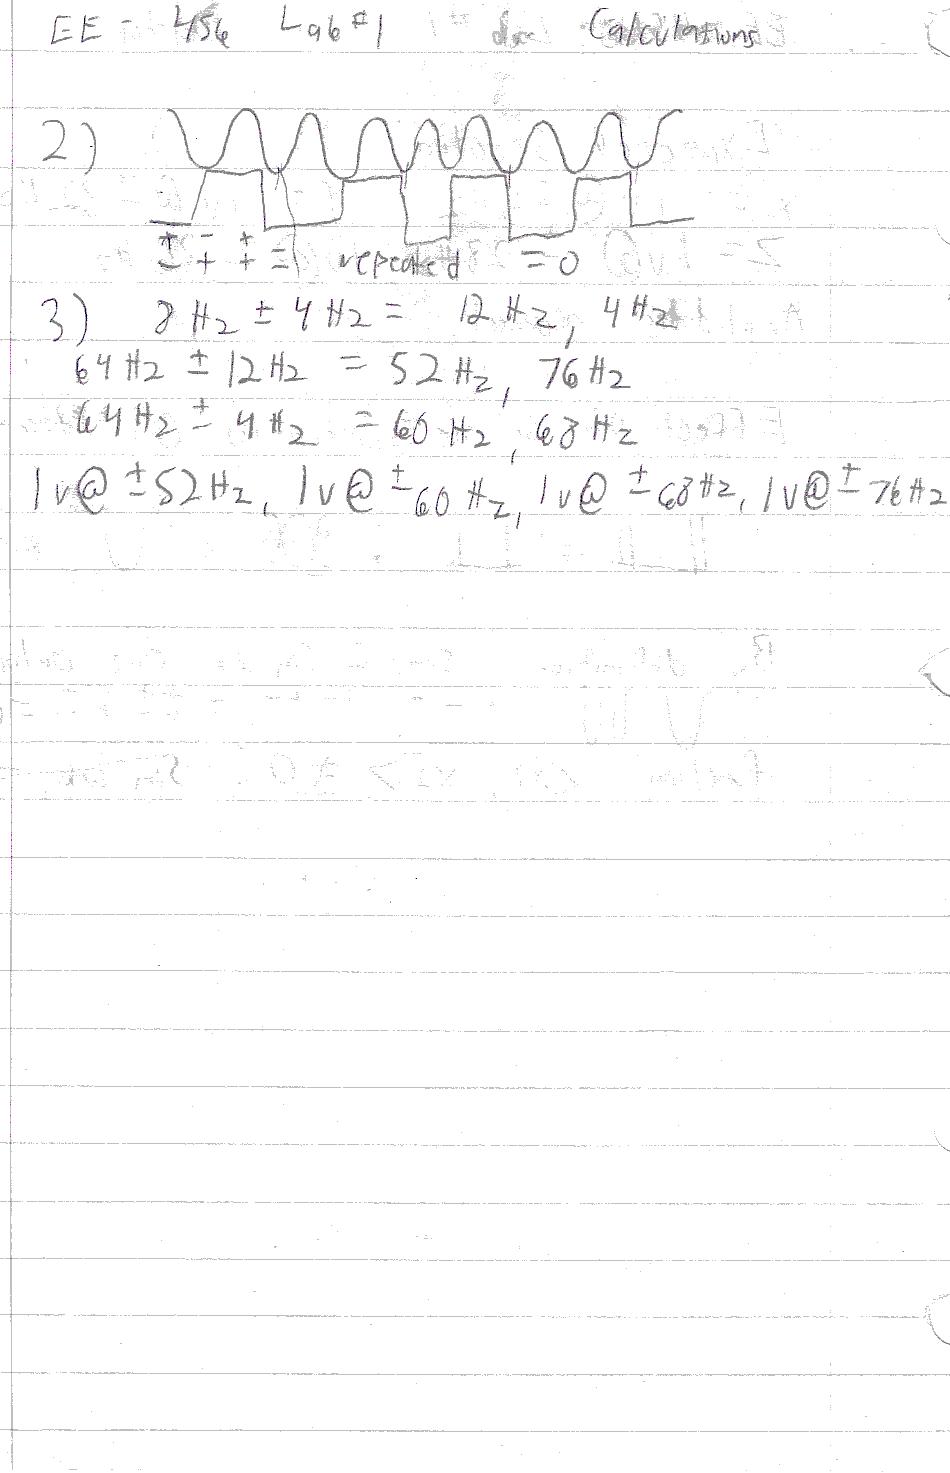
2) Q: Given an 4Hz squarewave
and a 8Hz sinewave, how could MatLab be used to prove that they
are orthogonal, prove it analytically.
A: Simulate the waves
using a -1^n exponential series for the squarewave, and the
cosine directly for the sinewave. Use the operator "xy=x*y'"
3) Q: Given sinewaves of 4Hz,
8Hz, and 64Hz, find the spectrum of the product of the waves.
A: 1v @ +/- 52Hz, 1v @
+/-60Hz, 1v @ +/-68Hz, 1v @ +/- 76Hz
Conclusions
This lab has
demonstrated the basics of the MatLab command set. I do not have
the ability to run MatLab on any computer, so instead, I chose to
run a combination of SciLab and GNU Octave. I found that the Octave
had more inherent variables (pi, etc) and was slightly more
accurate, and had syntax closer to MatLab, but SciLab had a lot more
functions, including those that interfaced with the system DSP. For
the exact command structure, please refer to the attachments.
Attachments
Original lab handout
Original lab data
Calculations
Octave log
SciLab log
GNU
Octave, version 2.0.17 (i686-pc-linux-gnu).
Copyright
(C) 1996, 1997, 1998, 1999, 2000, 2001, 2002 John W. Eaton.
This
is free software with ABSOLUTELY NO WARRANTY.
For
details, type `warranty'.
octave:1>
pi
pi
= 3.1416
octave:2>
n=0:255;
octave:3>
t=n/256;
octave:4>
f=4;
octave:5>
octave:5>
omega=2*pi*f;
octave:6>
x=cos(omega*t);
octave:7>
plot(t,x);
octave:8>
octave:8>
octave:8>
f2=32;
octave:9>
omega2=2*pi*f2;
octave:10>
y=cos(omega2*t);
octave:11>
plot(t,x,t,y);
octave:12>
z=x.*y;
octave:13>
plot(t,x,t,y,t,z)
octave:14>
X(1:64)=fft(z);
error:
A(I) = X: X must be a scalar or a vector with same length as I
error:
evaluating assignment expression near line 14, column 8
octave:14>
X(1:256)=fft(z);
octave:15>
plot(X)
octave:16>
plot(t,X)
octave:17>
plot(n,X)
octave:18>
X(1:256)=fft(x);
octave:19>
plot(n,X)
octave:20>
X(1:256)=fft(y);
octave:21>
plot(n,X)
octave:22>
X(1:256)=fft(y)
octave:23>
n2=0:64;
octave:24>
plot(n2,X);
error:
__plt2vv__: vector lengths must match
error:
evaluating index expression near line 52, column 5
error:
evaluating if command near line 51, column 3
error:
called from `__plt2vv__' in file
`/usr/local/share/octave/2.0.17/m/plot/__plt2vv__.m'
error:
called from `__plt2__' in file
`/usr/local/share/octave/2.0.17/m/plot/__plt2__.m'
error:
called from `__plt__' in file
`/usr/local/share/octave/2.0.17/m/plot/__plt__.m'
error:
called from `plot' in file
`/usr/local/share/octave/2.0.17/m/plot/plot.m'octave:24>
X(1:256)=fft(x);
octave:25>
plot(n,X);
octave:26>
X(1:256)=fft(y);
octave:27>
plot(n,X);
octave:28>
X(1:256)=fft(z);
octave:29>
plot(n,X);
octave:30>
Z=fft(z);
octave:31>
Z(37)
ans
= 6.4000e+01 - 3.2880e-13i
octave:32>
Z(1:256)=fft(z);
octave:33>
Z(37)
ans
= 6.4000e+01 - 3.2880e-13i
octave:34>
plot(n,Z);
octave:35>
Z(1:256)=fft(z)
octave:36>
z(37)
ans
= 0.92388
octave:37>
Z(37)
ans
= 6.4000e+01 - 3.2880e-13i
octave:38>
Z(37)=0;
octave:39>
Z(221)=0;
octave:40>
plot(n,Z);
octave:41>
z=real(ifft(Z));
octave:42>
plot(n,z);
octave:43>
xy=x*y;
error:
operator *: nonconformant arguments (op1 is 1x256, op2 is 1x256)
error:
evaluating assignment expression near line 43, column 3
octave:43>
xy=x*y';
octave:44>
xy=x*y'
xy
= 5.0583e-16
octave:45>
x1
error:
`x1' undefined near line 45 column 1
error:
evaluating expression near line 45, column 1
octave:45>
x1=sin(omega*t);
octave:46>
plot(t,x1)
octave:47>
xy1=x1*x'
xy1
= 5.2718e-15
octave:48>
x2=squarewave(t);
error:
`squarewave' undefined near line 48 column 4
error:
evaluating index expression near line 48, column 4
error:
evaluating assignment expression near line 48, column 3
octave:48>
x2=-sin(omega*t);
octave:49>
plot(t,x2);
octave:50>
xy2=x2*x'
xy2
= -5.2718e-15
octave:51>
===========
S c i l a b
===========
scilab-2.6
Copyright (C) 1989-2001 INRIA
Startup
execution:
loading initial environment
-->n=0:255;
-->
t=n/256;
-->f=4;
-->omega=2*pi*f;
!--error 4
undefined
variable : pi
-->pi=3.14156;
-->omega=2*pi*f;
-->x=cos(omega*t);
-->plot(t,x);
-->f2=32;
-->omega2=2*pi*f2;
-->y=cos(omega2*t);
-->plot([t,x][t,y])
!--error 3
waiting
for right parenthesis
-->plot2d(t,[x,y])
!--error 999
plot2d:
first and second arguments have incompatible dimensions
-->plot2d(t,[x
y])
!--error 999
plot2d:
first and second arguments have incompatible dimensions
-->n=0:255;
-->
t=n/256;
-->plot2d(t,[x
y])
!--error 999
plot2d:
first and second arguments have incompatible dimensions
-->n=0:255;
-->
t=n/256;
-->omega=2*pi*f;
-->pi=3.14156;
-->x=cos(omega*t);
-->f=4;
-->omega2=2*pi*f2;
-->plot2d(t,[x
y])
!--error 999
plot2d:
first and second arguments have incompatible dimensions
-->plot2d(t,
y])
!--error 3
waiting
for right parenthesis
-->plot2d(t,
y)
-->z=x.*y;
-->plot2d(t,
z)
-->X(1:64)=fft(z);
!--error 39
incorrect
number of arguments
-->X(1:256)=fft(z);
!--error 39
incorrect
number of arguments
-->X(1:255)=fft(z);
!--error 39
incorrect
number of arguments
-->X(0:255)=fft(z);
!--error 39
incorrect
number of arguments
-->X(0:255)=fft(z)
!--error 39
incorrect
number of arguments
-->fft(z)
!--error 39
incorrect
number of arguments
-->X(0:255)=fft(z,1);
!--error 21
invalid
index
-->X(0:255)=fft(z,-1);
!--error 21
invalid
index
-->X(1:256)=fft(z,-1);
-->X(1:256)=fft(z,-1)
X
=
column 1 to 3
! -
0.0025193 - 0.0025220 + 9.167E-08i - 0.0025302 + 1.839E-07i !
column 4 to 5
! -
0.0025440 + 2.772E-07i - 0.0025636 + 3.721E-07i !
column 6 to 7
! -
0.0025892 + 4.693E-07i - 0.0026212 + 5.695E-07i !
column 8 to 9
! -
0.0026601 + 6.733E-07i - 0.0027064 + 7.816E-07i !
column 10 to 11
! -
0.0027609 + 8.954E-07i - 0.0028246 + 0.0000010i !
column 12 to 13
[More
(y or n ) ?]
-->X(1:256)=fft(z,-1);
-->plot(n,X);
-->X(1:256)=fft(x,-1);
-->plot(n,X);
-->X(1:256)=fft(y,-1);
-->plot(n,X);
-->X(1:256)=fft(z,-1);
-->plot(n,X);
-->Z(1:256)=fft(z,-1);
-->Z(37)=0;
-->Z(221)=0;
-->plot(n,Z);
-->z=real(ifft(Z));
!--error 4
undefined
variable : ifft
-->z=realifft(Z,1));
!--error 4
undefined
variable : realifft
-->z=real(fft(Z,1));
-->plot(t,z);
-->xy=x*y;
!--error 10
inconsistent
multiplication
-->xy=x*y';
-->xy=x*y'
xy
=
-
0.0025193
-->x1=sin(omega*t);
-->xy1=x1*x'
xy1 =
0.0001310
-->x2=squarewave(t);
-->plot(t,x2)
-->t
t
=
column 1 to 6
!
0. 0.0039062 0.0078125 0.0117188 0.015625 0.0195312 !
column 7 to 11
!
0.0234375 0.0273438 0.03125 0.0351562 0.0390625 !
column 12 to 16
!
0.0429688 0.046875 0.0507812 0.0546875 0.0585938 !
column 17 to 21
!
0.0625 0.0664062 0.0703125 0.0742188 0.078125 !
column 22 to 26
!
0.0820312 0.0859375 0.0898438 0.09375 0.0976562 !
column 27 to 31
[More
(y or n ) ?]
-->x2=squarewave(f*t);
-->plot(t,x2)
-->plot2d(t,x2)
-->plot(t,z);
-->plot(t,x2);
-->x2
x2
=
column 1 to 11
!
1. 1. 1. 1. 1. 1. 1. 1. 1. 1. 1. !
column 12 to 22
!
1. 1. 1. 1. 1. 1. 1. 1. 1. 1. 1. !
column 23 to 33
!
1. 1. 1. 1. 1. 1. 1. 1. 1. 1. 1. !
column 34 to 44
!
1. 1. 1. 1. 1. 1. 1. 1. 1. 1. 1. !
column 45 to 55
!
1. 1. 1. 1. 1. 1. 1. 1. 1. 1. 1. !
column 56 to 66
[More
(y or n ) ?]
!
1. 1. 1. 1. 1. 1. 1. 1. 1. 1. 1. !
column 67 to 77
!
1. 1. 1. 1. 1. 1. 1. 1. 1. 1. 1. !
column 78 to 88
!
1. 1. 1. 1. 1. 1. 1. 1. 1. 1. 1. !
column 89 to 99
!
1. 1. 1. 1. 1. 1. 1. 1. 1. 1. 1. !
column 100 to 110
!
1. 1. 1. 1. 1. 1. 1. 1. 1. 1. 1. !
column 111 to 121
!
1. 1. 1. 1. 1. 1. 1. 1. 1. 1. 1. !
column 122 to 132
!
1. 1. 1. 1. 1. 1. 1. 1. 1. 1. 1. !
column 133 to 143
[More
(y or n ) ?]
!
1. 1. 1. 1. 1. 1. 1. 1. 1. 1. 1. !
column 144 to 154
!
1. 1. 1. 1. 1. 1. 1. 1. 1. 1. 1. !
column 155 to 165
!
1. 1. 1. 1. 1. 1. 1. 1. 1. 1. 1. !
column 166 to 176
!
1. 1. 1. 1. 1. 1. 1. 1. 1. 1. 1. !
column 177 to 187
!
1. 1. 1. 1. 1. 1. 1. 1. 1. 1. 1. !
column 188 to 198
!
1. 1. 1. 1. 1. 1. 1. 1. 1. 1. 1. !
column 199 to 209
!
1. 1. 1. 1. - 1. - 1. - 1. - 1. - 1. - 1. - 1. !
[More
(y or n ) ?]
column 210 to 220
! -
1. - 1. - 1. - 1. - 1. - 1. - 1. - 1. - 1. - 1. - 1. !
column 221 to 231
! -
1. - 1. - 1. - 1. - 1. - 1. - 1. - 1. - 1. - 1. - 1. !
column 232 to 242
! -
1. - 1. - 1. - 1. - 1. - 1. - 1. - 1. - 1. - 1. - 1. !
column 243 to 253
! -
1. - 1. - 1. - 1. - 1. - 1. - 1. - 1. - 1. - 1. - 1. !
column 254 to 256
! -
1. - 1. - 1. !
-->x2=squarewave(omega*t);
-->plot(t,x2);
-->xy2=x2*x'
xy2 =
-
5.97873
-->x2=squarewave(omega*t+(pi/2));
-->xy2=x2*x'
xy2 =
162.84382
-->j=sqrt(-1)
j
=
i
-->j=sqrt(-1);
-->e
!--error 4
undefined
variable : e
-->x2=exp(j*omega*t);
-->plot(t,x2);
-->x2=exp(-j*omega*t);
-->plot(t,x2);
-->x2=exp(j*omega*t);
-->plot(t,x2);
-->x2=exp(-j*omega*t);
-->plot(t,x2);
-->xy2=x2*x'
xy2 =
127.99867 - 0.0001310i
-->i
!--error 4
undefined
variable : i
-->x2=-sin(omega*t);
-->plot(t,x2)
-->xy2=x2*x'
xy2 =
-
0.0001310
-->